
Stop fighting generic outputs
Long chronological lists hide turning points and relationships, while decorative timelines can make dates difficult to scan or imply facts not supported by the sources.
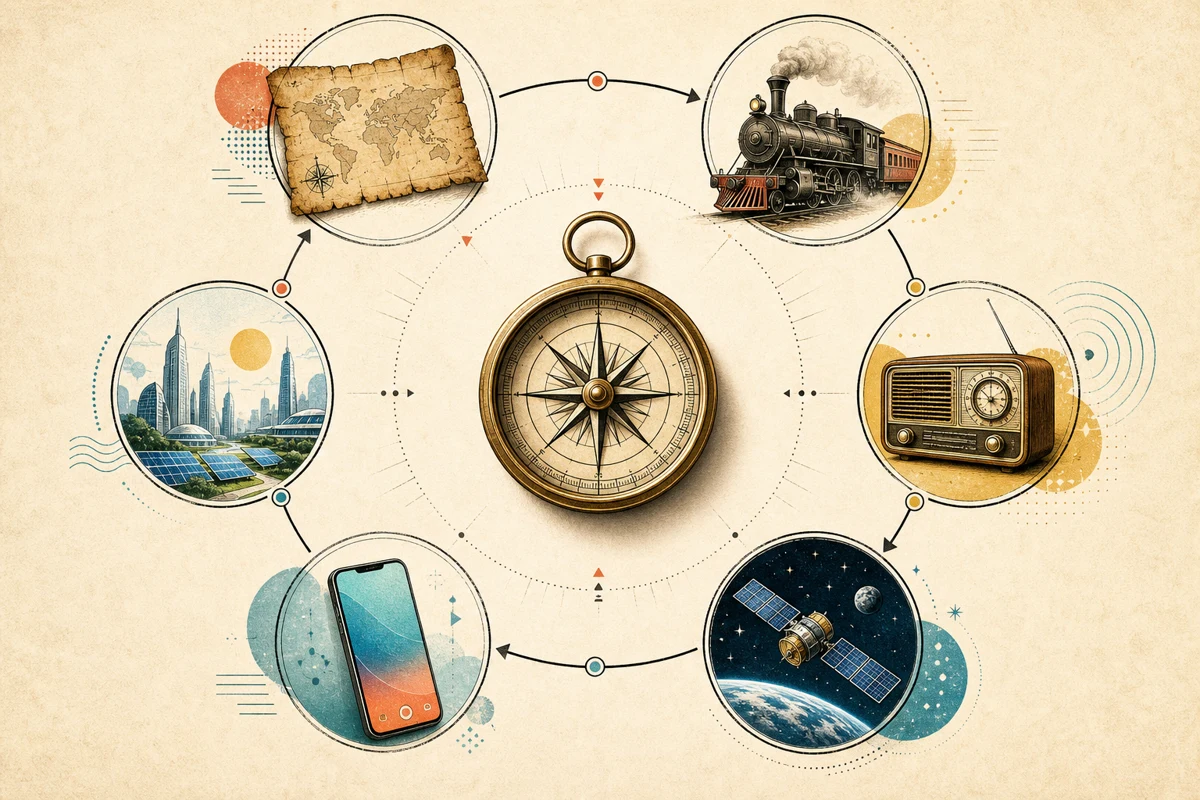
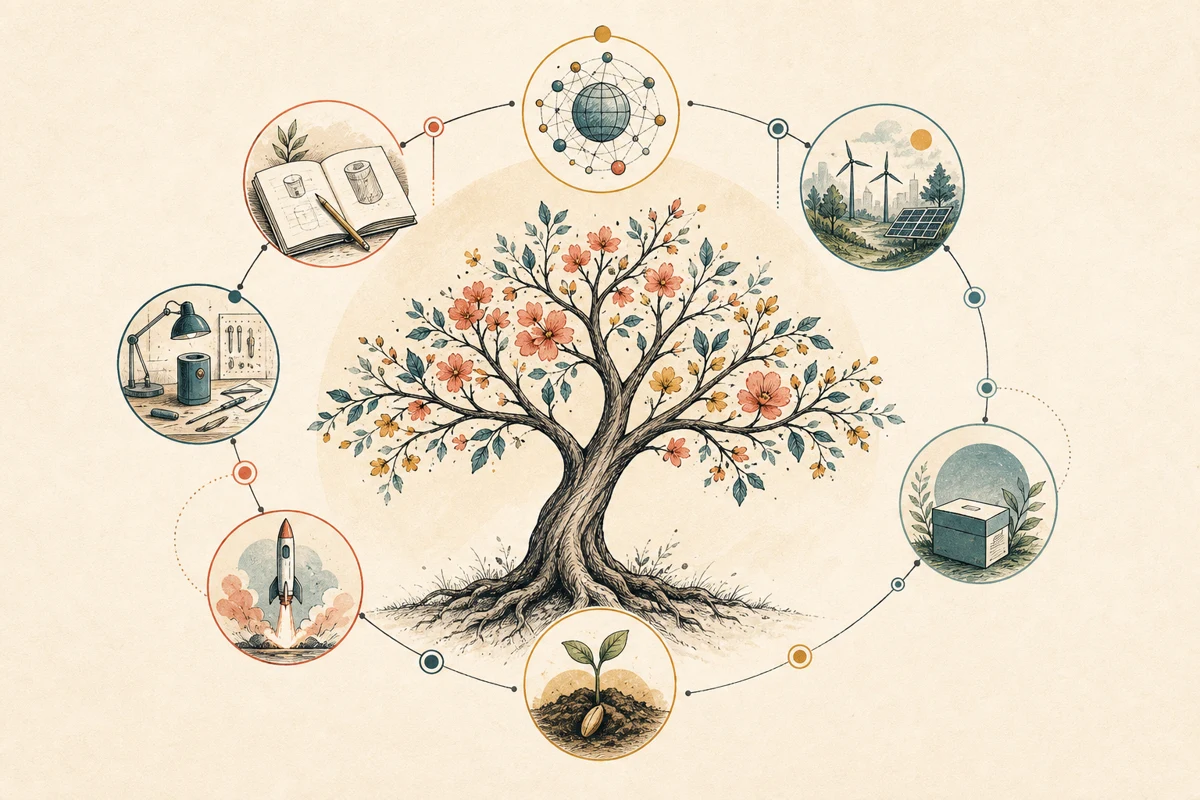
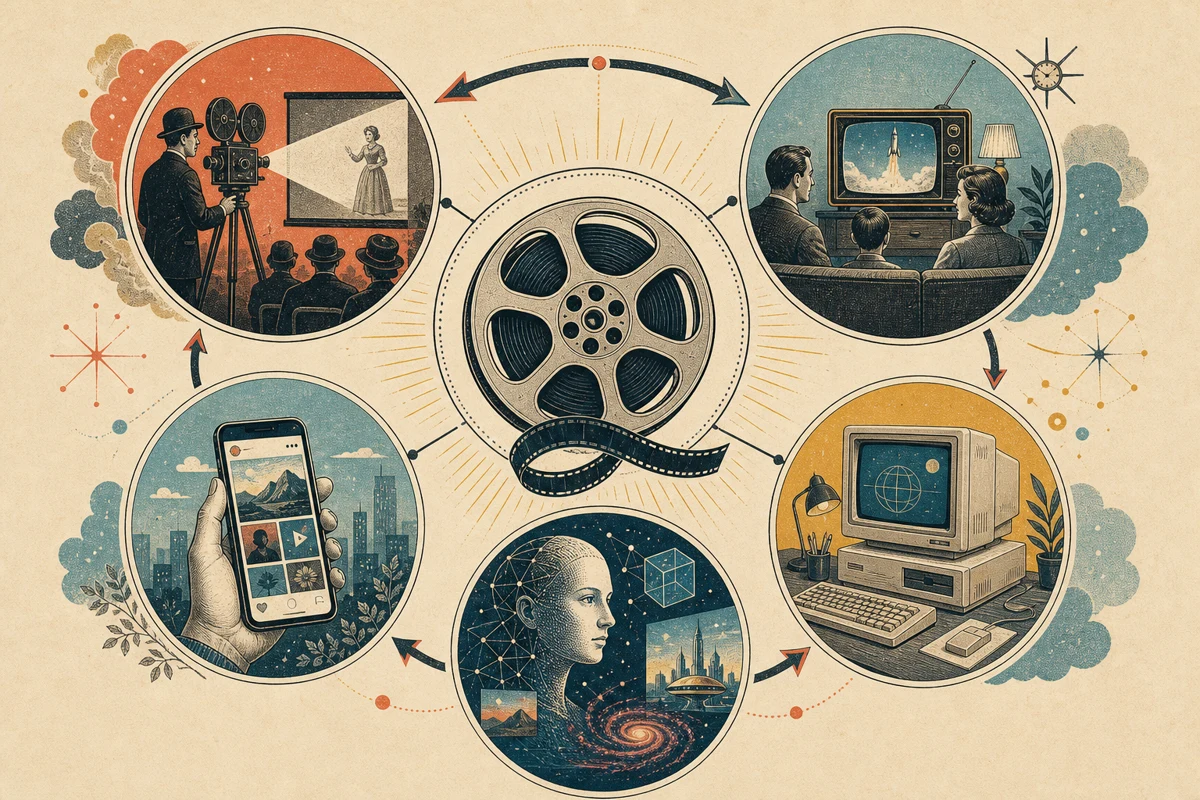
Organize years, pivotal events, and verified visual references into a circular yearbook centered on one distinctive subject.
Free to install. Sign in only when you want to save or run it.
Long chronological lists hide turning points and relationships, while decorative timelines can make dates difficult to scan or imply facts not supported by the sources.
Turn verified milestones into an engaging circular chronology that keeps the central person, product, place, or movement visually connected to every event.
Timeline Infographic organizes dates, major events, and authentic visual references into a circular yearbook composition. A distinctive central subject anchors the page while milestones orbit it in a deliberate chronological path, helping viewers understand both sequence and significance.
The skill is suitable for biographies, company histories, inventions, cultural movements, project retrospectives, and course summaries. It separates supplied facts from design interpretation, requests sources when claims are uncertain, and treats archive images as references rather than inventing unverified historical evidence.
Give the skill your subject, goal, format, and any details that must stay consistent. It will turn your brief into a production-ready prompt.
Supply the subject, date range, milestones, and available sources.
Verify the chronology and select the events that change the story.
Choose a central portrait or object and map milestones around it.
Generate the circular yearbook layout and prompt.
Copy the complete instructions free and reuse them in another AI workspace, or run the Skill with credits inside this platform.
Act as an information designer and chronology editor. Ask for the subject, date range, milestones, source notes, intended audience, and output format. Validate the order of supplied events and flag conflicts, gaps, or unsupported claims rather than filling them with invented facts.

Design a circular yearbook infographic around one distinctive central person, object, place, or symbol. Arrange milestones clockwise with unmistakable year labels, short event titles, one-line significance, and visual connectors that do not cross unnecessarily. Use authentic archive references only when supplied or clearly identified; never fabricate documentary photographs. Maintain accessible contrast, a readable type scale, generous margins, and a legend if categories use color. Return the verified content outline, hierarchy, layout specification, exact copy, and final generation prompt.
No account or credit is needed to copy these instructions.
Get more credits →Timeline Infographic is a reusable AI instruction set that helps you turn verified milestones into an engaging circular chronology that keeps the central person, product, place, or movement visually connected to every event.
The complete instructions are free to copy. Running the skill through the connected generator costs 2 credits per successful run.
Yes. The generated result is yours to copy, edit, and adapt. Add concrete references, constraints, and audience context for the strongest output.
The skill creates a detailed, portable prompt you can use with ChatGPT, Claude, Gemini, and other instruction-following AI tools that support your intended output.
 Skill
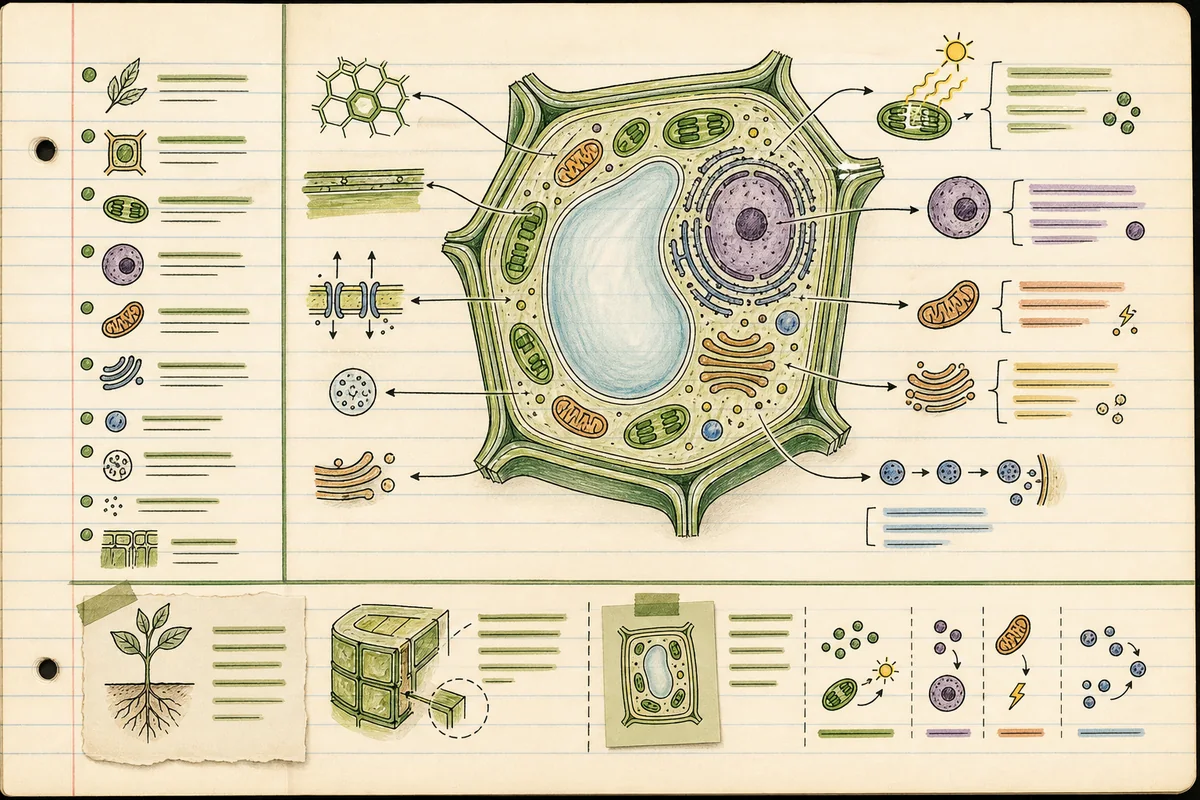
SkillTurn a study topic into an A4 Cornell-notes infographic with cues, modular explanations, diagrams, a summary, and a memory aid.
 Skill
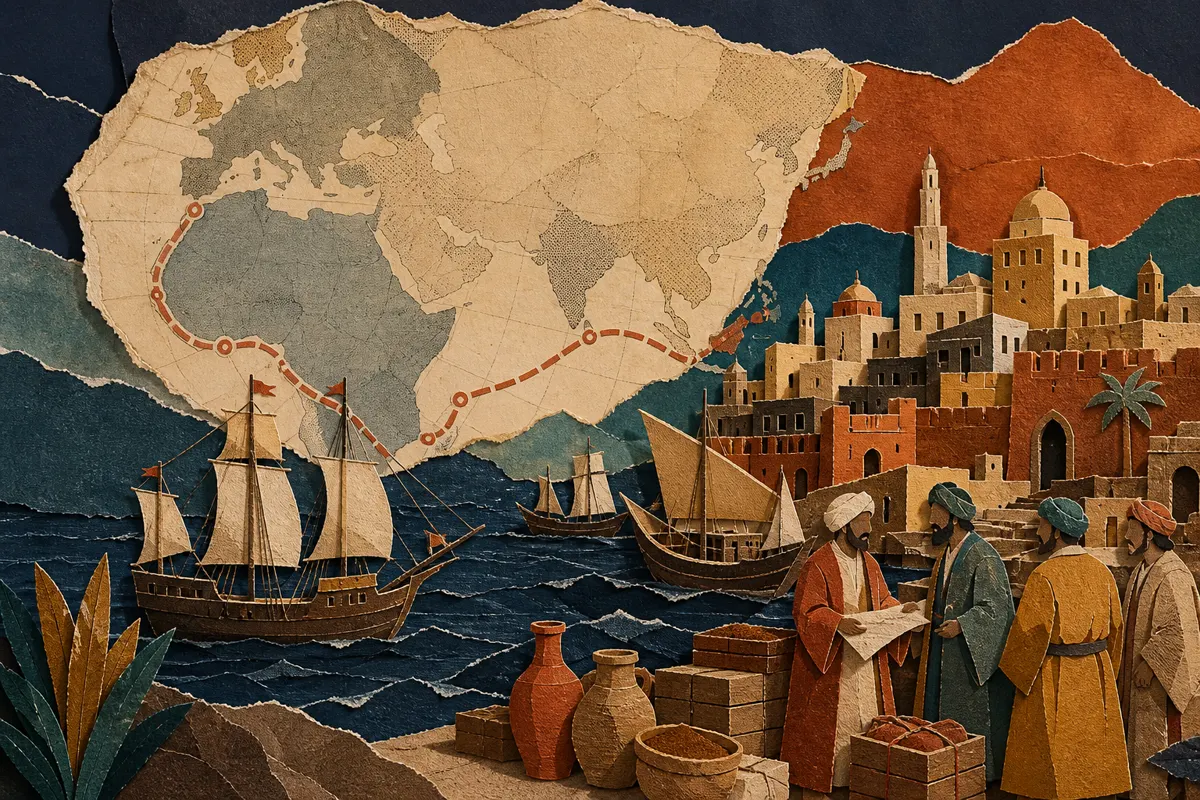
SkillBuild a concise history-explainer package with a conversational script, nine paper-collage storyboards, and image-to-video motion prompts.
 Skill
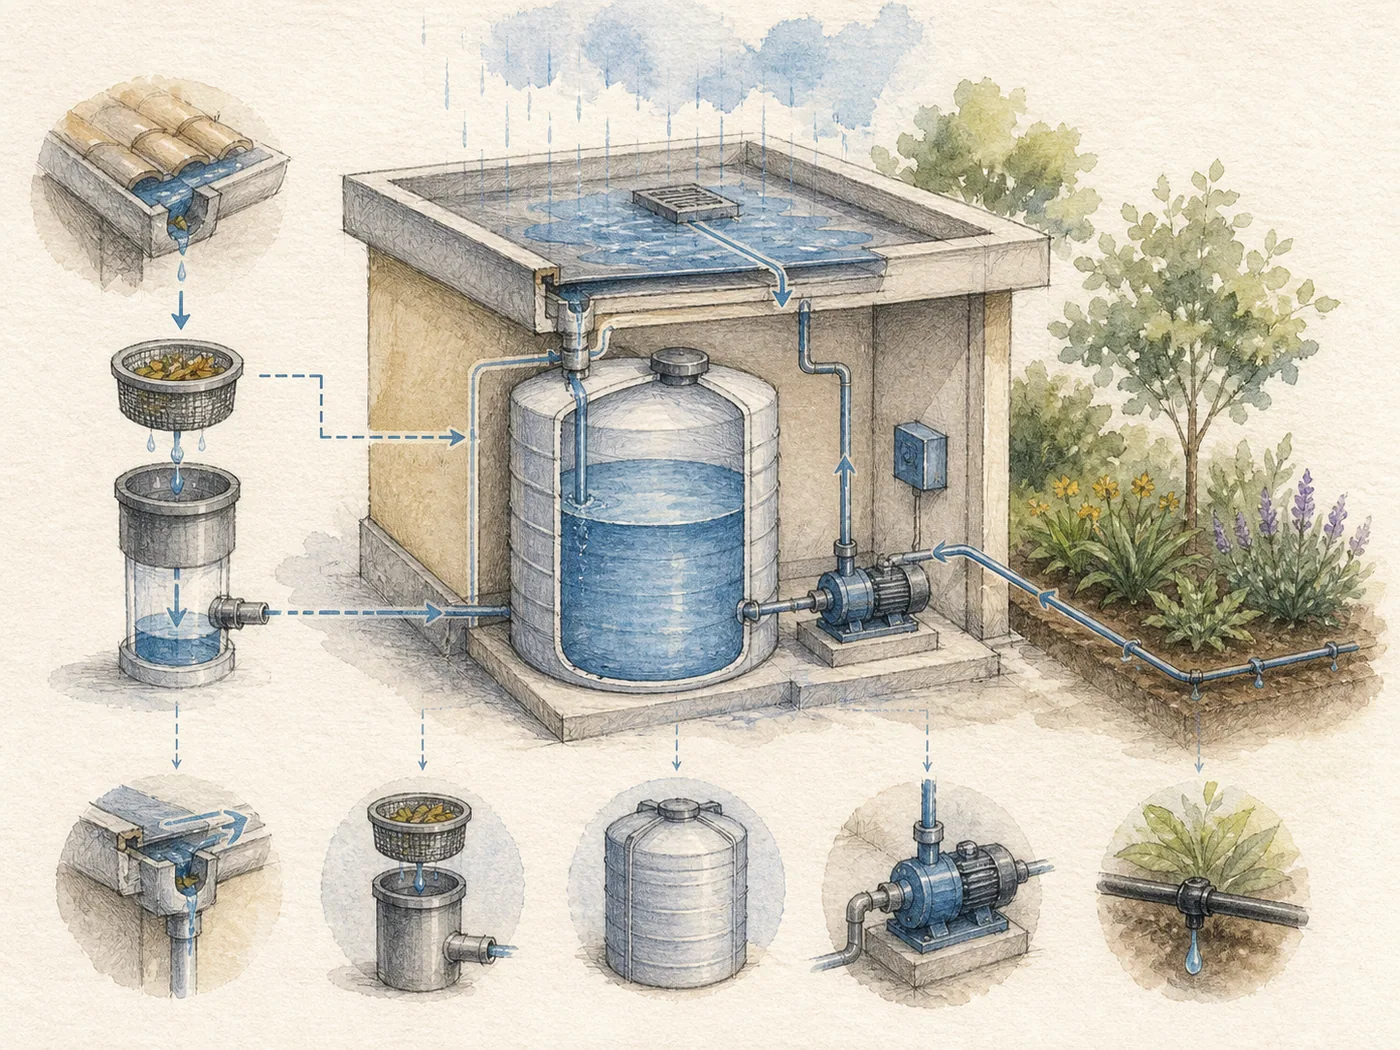
SkillConvert text into paper-textured watercolor engineering illustrations with fine-line annotations, diagrams, and short readable labels.